Attribute Table
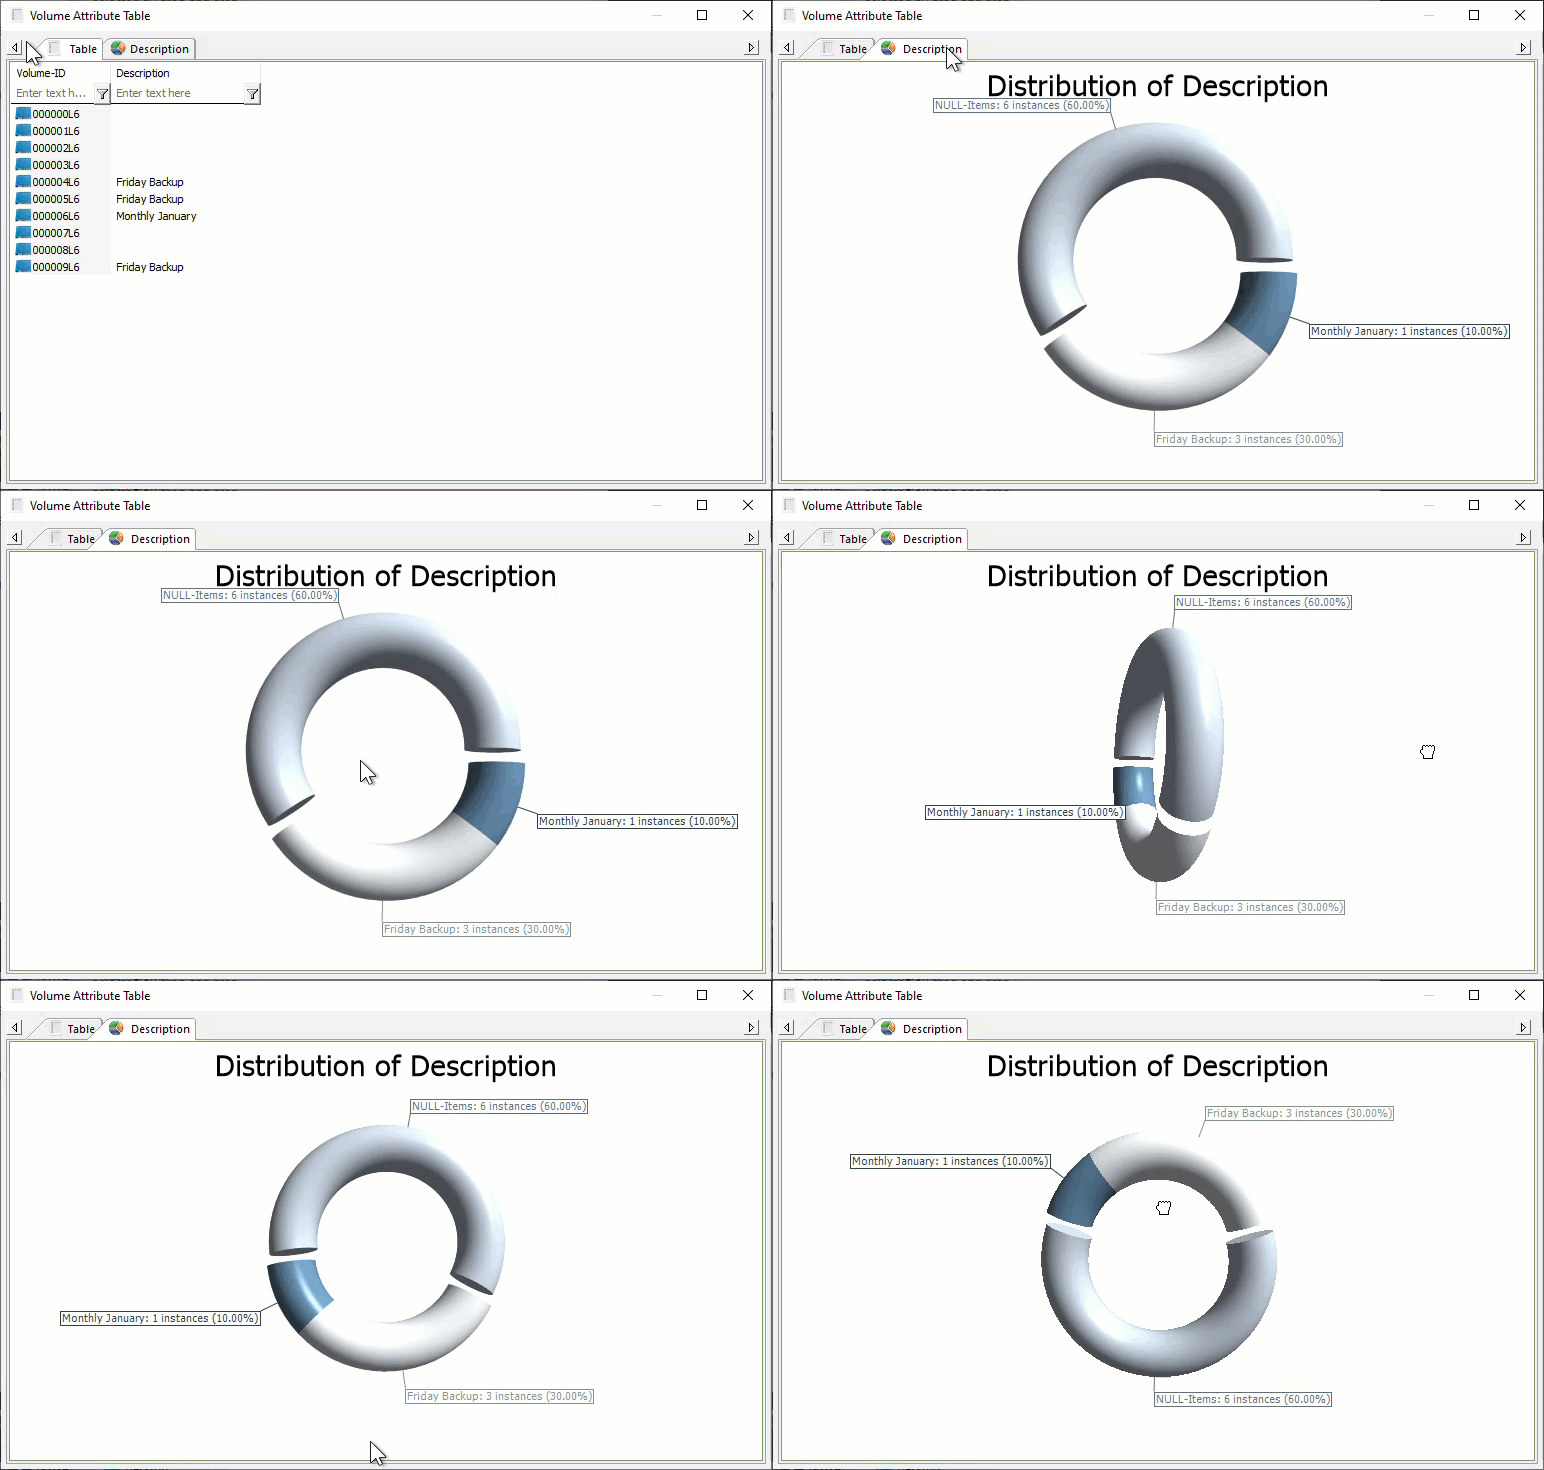
The Attribute table displays Volume Attribute data in a table format and 3D pie chart. Volumes are displayed in Volume-ID order by default.
Selecting Volumes for Display
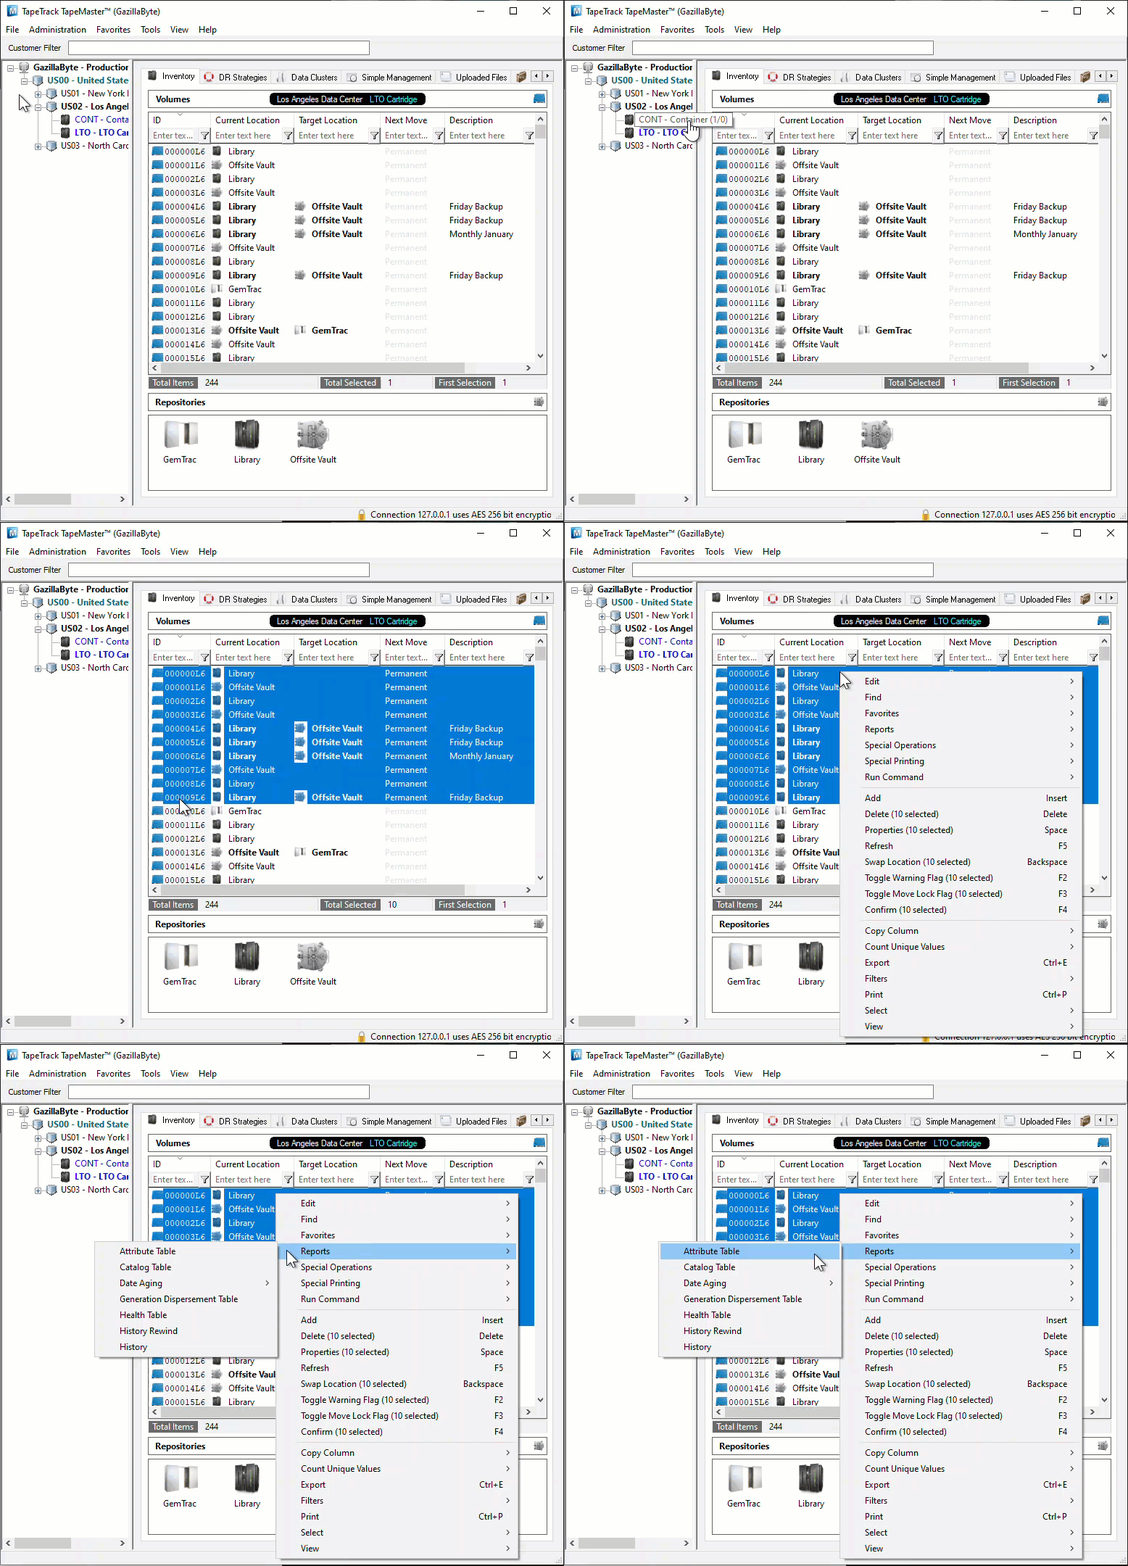
Select all Volumes by right-clicking in the Inventory window and select Select→All, or using shift+click and/or control+click select the range of Volumes required.
Right-click the selected Volumes and click Report→Attribute Table.
The Attribute Table will display the selected Volumes along with the currently displayed Attribute value on the Table tab.
The Description tab displays the number of unique description values and the number of instances each value appears. The Pie Chart can be rotated or flipped as required using the mouse cursor and zoomed in and out using the mouse scroll dial.
Data in the Table tab can be filtered by using the TapeTrack String Filters

