master:repository_usage
Usage History Tab
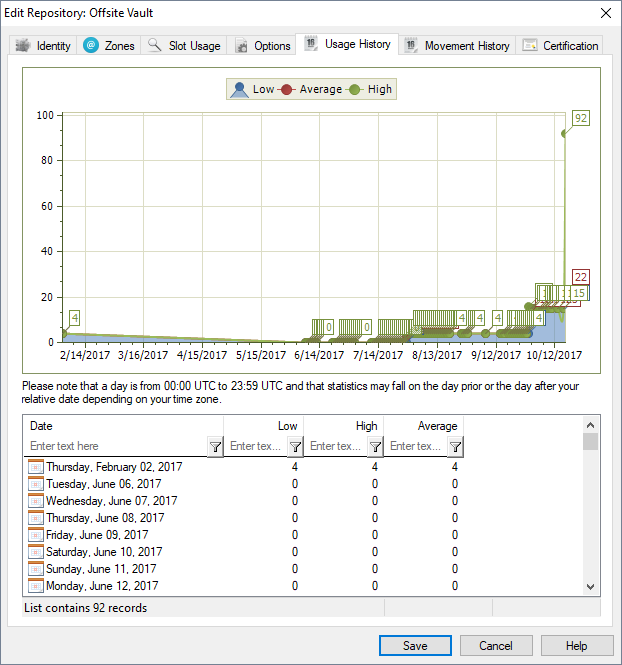
The Usage History Tab in the Repository Properties Window displays a visualization and a list of Volume movements for this Repository on any given day, including Population Highs, Lows, and Averages.
Displayed Information
The Y-Axis displays how many Volumes populated this Repository on a given date.
The X-Axis displays the aforementioned dates.
The blue number displays the population low for a given date.
The red number displays the population average for a given date.
The green number displays the population high for a given date.
master/repository_usage.txt · Last modified: 2025/01/21 22:07 by 127.0.0.1

