master:view_attribute_pie
Attribute Pie
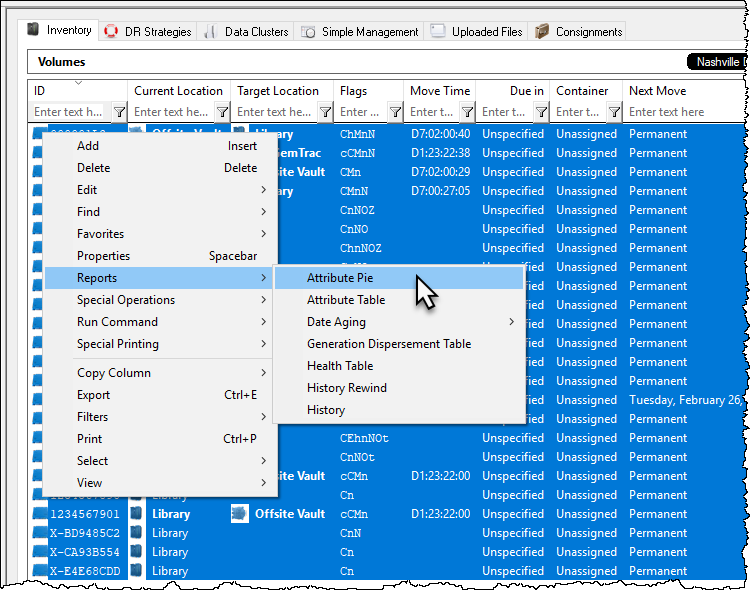
The Attribute pie graph displays volume Attribute data in a simple easy to read format. Volumes are grouped by similar Attribute values and displayed in a % based format with a color coded key.
Selecting Volumes for Display
master/view_attribute_pie.txt · Last modified: 2025/01/21 22:07 by 127.0.0.1


